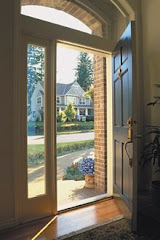
The Lake County, Fla., home Paul Fallman shares with his wife and two daughters has 4,000 square feet of living space. Yet his electric bills have averaged just $180 a month so far this year, despite record-low winter temperatures and close-to-record summer highs.
His natural-gas bill for two tankless water heaters and a fireplace averages $25 a month.
“My focus with this house was energy-efficiency,” says Fallman, owner of Fallman Design & Construction in Clermont, Fla. “It’s so easy to do. It’s a great marketing angle. And it’s the right thing to do.”
The key to the energy-efficiency of the lakefront home, which is certified by the Florida Green Building Coalition, is its south-facing orientation, said Fallman, who has made green-building his specialty.
Before starting construction, he commissioned a solar-path study to track the angle of the sun in winter and summer. He used the information to design a home that would be flooded with sunlight during the cooler months, but shaded by porches, balconies and extra-wide roof overhangs when temperatures soar.
“It’s the single thing a builder can do to make a home more efficient without much more expense,” he says.
The three-garage home on the site of the historic Clermont Yacht Club, which was torn down in the early 1950s, is also angled to maximize views across two-mile-wide Lake Minnehaha. Facing the lake on the first floor are the kitchen, dining room, living room and master suite, which either open onto screened porches or are shaded by wide roof overhangs and high-performance windows—tinted, Low-E4 and argon-filled. Upstairs, covered balconies or roof overhangs shade the windows and walls of the three bedrooms and loft area. An apartment above a second garage has similar features.
To receive certification from the green building coalition, a home must be inspected by a green certifier and an energy rater, Fallman says. The green certifier makes as many as 10 checks of the site and home before and during construction, checking for items such as site drainage and properly sealed plumbing pipes, doors and windows. The energy rater conducts a duct-blast test, blower-door test and thermal-envelope test to determine how airtight the home is.
The Fallman home has a Home Energy Rating System (HERS) score of 62 out of 100. The lower the score, the more energy-efficient the home. For a home to be Energy Star-rated, it must score 85 or lower.
At present, about 70% of the payback for building green is improved energy-efficiency, Fallman says. Spending $3,000-$5,000 on equipment upgrades and an additional $2,000-$3,000 on green construction will pay for itself in 5-10 years, he figures.
Certainly, better air-handling equipment cuts down on dust and indoor humidity; better insulation creates a quieter home; drip irrigation in the yard saves water.
The Fallman home, which is on the market for $1.1 million, also features these energy-efficient elements:
-Fifty-year shingle roof with Icynene spray-foam insulation, which keeps cool air in, heat and dampness out; protects against dust and insects; and improves structural strength.
-Concrete-block walls with rigid insulation on the first floor, and 2×6 frame with R-19 batt insulation on the second floor.
-Semi-air conditioned, 200-square-foot attic, which keeps ducts about 30 degrees cooler in the summer so the air-conditioner doesn’t have to work as hard.
-Low-E4 windows with tinted, high-performance glass and wood frames which don’t conduct heat.
-Non-conductive fiberglass doors with insulated glass.
-Dual-compressor 20 SEER (seasonal energy efficiency ratio) air-conditioner and timeable bathroom fans for humidity control.
-Two tankless gas water heaters.
-Gas fireplace with electric ignition.
-Windows at the top of the stairs to vent rising hot air and ceiling fans in many rooms.
-Energy-Star appliances, which use less energy.
-Compact fluorescent lighting.
(c) 2010, The Orlando Sentinel (Fla.).
Distributed by McClatchy-Tribune Information Services.
Saturday, September 4, 2010


Thursday, September 2, 2010
Pending Home Sales Post Surprise Jump in July
Pending sales of previously owned U.S. homes rose unexpectedly in July, an industry group said on Thursday, suggesting a tax credit-related housing market decline was close to bottoming.
The National Association of Realtors said its Pending Home Sales Index, based on contracts signed in July, increased 5.2 percent to 79.4 from June.
June contracts were revised to show a slightly bigger 2.8 percent decline instead of the previously reported 2.6 percent fall.
Compared to the July last year, pending home sales fell 19.1 percent. Economists polled by Reuters forecast the index, which leads existing home sales by a month or two, falling 1.0 percent in July.
Home sales and building activity have dropped sharply following the end in April of a popular tax credit for home buyers.
"Home sales will remain soft in the months ahead, but improved affordability conditions should help with a recovery," said Lawrence Yun, NAR chief economist.
The National Association of Realtors said its Pending Home Sales Index, based on contracts signed in July, increased 5.2 percent to 79.4 from June.
June contracts were revised to show a slightly bigger 2.8 percent decline instead of the previously reported 2.6 percent fall.
Compared to the July last year, pending home sales fell 19.1 percent. Economists polled by Reuters forecast the index, which leads existing home sales by a month or two, falling 1.0 percent in July.
Home sales and building activity have dropped sharply following the end in April of a popular tax credit for home buyers.
"Home sales will remain soft in the months ahead, but improved affordability conditions should help with a recovery," said Lawrence Yun, NAR chief economist.
Tuesday, August 17, 2010
Housing Starts Rise 1.7 Percent in July
Nationwide housing starts inched up 1.7 percent to a seasonally adjusted annual rate of 546,000 units in July from a downwardly revised figure in the previous month, according to U.S. Commerce Department figures released today. The gain occurred entirely on the multifamily side, with single-family housing production falling 4.2 percent to 432,000 units.
“Builders are very reluctant to build more homes in view of the current state of the economy and weak buyer demand,” noted Bob Jones, chairman of the National Association of Home Builders (NAHB) and a home builder from Bloomfield Hills, Mich.
“Right now the housing market is essentially in a holding pattern,” acknowledged NAHB Chief Economist David Crowe. “As our latest member surveys have indicated, builders are seeing greater hesitancy among potential home buyers who are uncertain about what’s in store for the economy and jobs going forward. That said, favorable home buying conditions including historically low mortgage rates and low house prices should help spur additional demand as the job market gradually improves later this year.”
The entire 1.7 percent gain in housing production this July was due to a 32.6 percent jump on the more volatile multifamily side, which brought that sector back closer to trend at a 114,000-unit rate following a major dip in the previous month. Meanwhile, single-family housing production declined 4.2 percent to a seasonally adjusted annual rate of 432,000 units, its lowest mark since May of 2009.
Two regions registered improved starts activity in July, with the Northeast and Midwest each posting double-digit gains, of 30.5 percent and 10.7 percent, respectively. The South, which is the country’s largest housing market, posted a 6.3 percent decline in starts this July, while the West posted no change in starts activity.
Permit issuance, which can be an indicator of future building activity, declined 3.1 percent to a seasonally adjusted annual rate of 565,000 units in July. Single-family permits fell 1.2 percent to 416,000 units, while multifamily permits fell 8 percent to 149,000 units. Regionally, permits fell nearly 26 percent in the Northeast, 1.1 percent in the Midwest, and 4.9 percent in the West, but gained 3.9 percent in the South in July.
“Builders are very reluctant to build more homes in view of the current state of the economy and weak buyer demand,” noted Bob Jones, chairman of the National Association of Home Builders (NAHB) and a home builder from Bloomfield Hills, Mich.
“Right now the housing market is essentially in a holding pattern,” acknowledged NAHB Chief Economist David Crowe. “As our latest member surveys have indicated, builders are seeing greater hesitancy among potential home buyers who are uncertain about what’s in store for the economy and jobs going forward. That said, favorable home buying conditions including historically low mortgage rates and low house prices should help spur additional demand as the job market gradually improves later this year.”
The entire 1.7 percent gain in housing production this July was due to a 32.6 percent jump on the more volatile multifamily side, which brought that sector back closer to trend at a 114,000-unit rate following a major dip in the previous month. Meanwhile, single-family housing production declined 4.2 percent to a seasonally adjusted annual rate of 432,000 units, its lowest mark since May of 2009.
Two regions registered improved starts activity in July, with the Northeast and Midwest each posting double-digit gains, of 30.5 percent and 10.7 percent, respectively. The South, which is the country’s largest housing market, posted a 6.3 percent decline in starts this July, while the West posted no change in starts activity.
Permit issuance, which can be an indicator of future building activity, declined 3.1 percent to a seasonally adjusted annual rate of 565,000 units in July. Single-family permits fell 1.2 percent to 416,000 units, while multifamily permits fell 8 percent to 149,000 units. Regionally, permits fell nearly 26 percent in the Northeast, 1.1 percent in the Midwest, and 4.9 percent in the West, but gained 3.9 percent in the South in July.
Friday, August 13, 2010
Broad Stabilization in Second Quarter Metro Area Home Prices with Strong Sales
The real estate trend in firming home prices solidified in the second quarter with more metropolitan areas showing increases from a year ago, aided by a surge in home sales driven by the home buyer tax credit, according to the latest survey by the National Association of Realtors. In the second quarter, 100 out of 155 metropolitan statistical areas (MSAs) had higher median existing single-family home prices in comparison with the second quarter of 2009, including 14 with double-digit increases; two were unchanged and 53 metros showed price declines. In the first quarter of this year, 91 areas had higher prices, while only 26 MSAs experienced annual price gains in the second quarter of 2009.
The national median existing single-family price was $176,900 in the second quarter, up 1.5% from $174,200 in the same period of 2009. The median is where half sold for more and half sold for less. Distressed homes accounted for 32% of second quarter sales, down from 36% a year ago.
Lawrence Yun, NAR chief economist, said the correction in home prices appears to have ended in 2009. “All year we’ve been seeing relatively flat national home prices, which appear to be supported by market fundamentals,” he said. “Prices in some areas remain below replacement construction costs, so even with an elevated supply of existing homes on the market, we don’t expect any consequential movement in home prices for the foreseeable future. Very low inventory of newly built homes will also help to support home values.”
Yun urged caution on interpreting price data. “The median price is influenced by the mix of homes that were sold and do not reflect pure appreciation or depreciation,” he said. “The recorded home prices in many markets were significantly depressed last year because of a large percentage of distressed homes sold at discount. Now as more normal, non-distressed home sales are occurring, the median price in many areas is showing higher values.”
Total state existing-home sales, including single-family and condo, rose 9.1% to a seasonally adjusted annual rate of 5.61 million in the second quarter from 5.14 million in the first quarter, and were 17.3% above the 4.78 million-unit pace in the second quarter of 2009.
Sales increased from the first quarter in 44 states and the District of Columbia; 47 states and D.C. had increases over year-ago sales levels.
Regionally, the median existing single-family home price in the Northeast declined 3.2% to $238,000 in the second quarter from a year earlier. Existing-home sales in the Northeast jumped 14.9% in the second quarter to a level of 980,000 and are 23.6% above the second quarter of 2009.
In the Midwest, the median existing single-family home price increased 1.4% to $148,500 in the second quarter from the second quarter of last year. Existing-home sales in the Midwest rose 14.5% in the second quarter to a pace of 1.30 million and are 20.9% above the same period in 2009.
In the South, the median existing single-family home price slipped 2.0% to $155,500 in the second quarter from the second quarter of 2009. Existing-home sales in the South increased 10.9% in the second quarter to an annual rate of 2.10 million and are 18.8% above a year ago.
The median existing single-family home price in the West rose 2.6% to $219,700 in the second quarter from a year ago. Existing-home sales in the West fell 2.6% in the second quarter to an annual rate of 1.23 million but are 7.6% higher than the second quarter of 2009.
The national median existing single-family price was $176,900 in the second quarter, up 1.5% from $174,200 in the same period of 2009. The median is where half sold for more and half sold for less. Distressed homes accounted for 32% of second quarter sales, down from 36% a year ago.
Lawrence Yun, NAR chief economist, said the correction in home prices appears to have ended in 2009. “All year we’ve been seeing relatively flat national home prices, which appear to be supported by market fundamentals,” he said. “Prices in some areas remain below replacement construction costs, so even with an elevated supply of existing homes on the market, we don’t expect any consequential movement in home prices for the foreseeable future. Very low inventory of newly built homes will also help to support home values.”
Yun urged caution on interpreting price data. “The median price is influenced by the mix of homes that were sold and do not reflect pure appreciation or depreciation,” he said. “The recorded home prices in many markets were significantly depressed last year because of a large percentage of distressed homes sold at discount. Now as more normal, non-distressed home sales are occurring, the median price in many areas is showing higher values.”
Total state existing-home sales, including single-family and condo, rose 9.1% to a seasonally adjusted annual rate of 5.61 million in the second quarter from 5.14 million in the first quarter, and were 17.3% above the 4.78 million-unit pace in the second quarter of 2009.
Sales increased from the first quarter in 44 states and the District of Columbia; 47 states and D.C. had increases over year-ago sales levels.
Regionally, the median existing single-family home price in the Northeast declined 3.2% to $238,000 in the second quarter from a year earlier. Existing-home sales in the Northeast jumped 14.9% in the second quarter to a level of 980,000 and are 23.6% above the second quarter of 2009.
In the Midwest, the median existing single-family home price increased 1.4% to $148,500 in the second quarter from the second quarter of last year. Existing-home sales in the Midwest rose 14.5% in the second quarter to a pace of 1.30 million and are 20.9% above the same period in 2009.
In the South, the median existing single-family home price slipped 2.0% to $155,500 in the second quarter from the second quarter of 2009. Existing-home sales in the South increased 10.9% in the second quarter to an annual rate of 2.10 million and are 18.8% above a year ago.
The median existing single-family home price in the West rose 2.6% to $219,700 in the second quarter from a year ago. Existing-home sales in the West fell 2.6% in the second quarter to an annual rate of 1.23 million but are 7.6% higher than the second quarter of 2009.
Friday, July 30, 2010
Remodeling Dips but Shows Signs of Stabilization
The remodeling market slid backward during the second quarter, according to the latest National Association of Home Builders' (NAHB) Remodeling Market Index (RMI). The RMI (combining current and future market indicators) sunk to 40.7 from 43.8 in the first quarter. Current market conditions slid back to 42.6 from 44.5 in the previous quarter. Future indicators of remodeling business declined to 38.9 from 43.1 in the last quarter.
The RMI measures market demand for current and future residential remodeling projects based on remodelers' perceptions and indicators of future activity like calls for bids. Any number below 50 indicates that more remodelers say market conditions are getting worse than report improving conditions. The RMI has been running below 50 since the final quarter of 2005 and during the last quarter approached break even again.
"Remodelers are suffering from weak consumer confidence and constricted credit lines," said NAHB Remodelers Chairman Donna Shirey, CGR, CAPS, CGP, a remodeler from Issaquah, Wash. "Homeowners are delaying remodeling projects because of economic uncertainty."
The current conditions indices for the remodeling market worsened in two regions: Northeast 41.4 (from 46.6 in the first quarter); and South 42.4 (from 44.1). However, current remodeling indices improved in the Midwest 44.7 (from 43.8) and the West 42.0 (from 34.8). Major additions fell to 44.2 (from 48.0), as did minor additions to 45.8 (from 47.3). Maintenance and repair indicators showed a milder decline, from 37.3 to 36.6.
All the indices for future remodeling business declined. Calls for bids dropped to 46.2 (from 49.4). Work committed for the next three months slumped to 27.9 (from 29.9). The backlog of remodeling jobs dipped to 37.7 (from 44.8), and appointments for proposals slid to 43.7 (from 48.1).
Responding to additional special questions in the survey, remodelers also reported on the changing composition of remodeling projects. Sixty-one percent said bathroom remodeling was one of their most common projects during the first half of 2010. Kitchen remodeling came next with 52 percent. In previous years, kitchen remodeling was reported as the most common activity by more than 70 percent of remodeler respondents.
In general, comparisons to historical data show that larger remodeling projects (such as room additions, whole house remodeling, bathroom additions, and second story additions) have been on the decline for several years. Smaller remodeling jobs (such as window and door replacements) have remained relatively steady, or, in the case of handyman services, actually increased. For example, only 29 percent of remodelers reported that room additions were a common activity in 2010, compared to 70 percent in 2004. Conversely, none of the professional remodelers responding to the survey reported that it was common for their companies to perform handyman services in 2004, while 33 percent of remodelers were regularly providing handyman work in the first half of 2010.
"While remodelers are continuing to struggle, we expect the rest of 2010 to be a period of stabilization for remodeling, with the first stages of recovery emerging by the end of the year, followed by a more robust recovery beginning early next year," said NAHB Chief Economist David Crowe. "For now, professional remodelers are taking on smaller projects and working to find consumers willing to spend money despite the economic uncertainty."
For more information about remodeling, visit www.nahb.org/remodel.
The RMI measures market demand for current and future residential remodeling projects based on remodelers' perceptions and indicators of future activity like calls for bids. Any number below 50 indicates that more remodelers say market conditions are getting worse than report improving conditions. The RMI has been running below 50 since the final quarter of 2005 and during the last quarter approached break even again.
"Remodelers are suffering from weak consumer confidence and constricted credit lines," said NAHB Remodelers Chairman Donna Shirey, CGR, CAPS, CGP, a remodeler from Issaquah, Wash. "Homeowners are delaying remodeling projects because of economic uncertainty."
The current conditions indices for the remodeling market worsened in two regions: Northeast 41.4 (from 46.6 in the first quarter); and South 42.4 (from 44.1). However, current remodeling indices improved in the Midwest 44.7 (from 43.8) and the West 42.0 (from 34.8). Major additions fell to 44.2 (from 48.0), as did minor additions to 45.8 (from 47.3). Maintenance and repair indicators showed a milder decline, from 37.3 to 36.6.
All the indices for future remodeling business declined. Calls for bids dropped to 46.2 (from 49.4). Work committed for the next three months slumped to 27.9 (from 29.9). The backlog of remodeling jobs dipped to 37.7 (from 44.8), and appointments for proposals slid to 43.7 (from 48.1).
Responding to additional special questions in the survey, remodelers also reported on the changing composition of remodeling projects. Sixty-one percent said bathroom remodeling was one of their most common projects during the first half of 2010. Kitchen remodeling came next with 52 percent. In previous years, kitchen remodeling was reported as the most common activity by more than 70 percent of remodeler respondents.
In general, comparisons to historical data show that larger remodeling projects (such as room additions, whole house remodeling, bathroom additions, and second story additions) have been on the decline for several years. Smaller remodeling jobs (such as window and door replacements) have remained relatively steady, or, in the case of handyman services, actually increased. For example, only 29 percent of remodelers reported that room additions were a common activity in 2010, compared to 70 percent in 2004. Conversely, none of the professional remodelers responding to the survey reported that it was common for their companies to perform handyman services in 2004, while 33 percent of remodelers were regularly providing handyman work in the first half of 2010.
"While remodelers are continuing to struggle, we expect the rest of 2010 to be a period of stabilization for remodeling, with the first stages of recovery emerging by the end of the year, followed by a more robust recovery beginning early next year," said NAHB Chief Economist David Crowe. "For now, professional remodelers are taking on smaller projects and working to find consumers willing to spend money despite the economic uncertainty."
For more information about remodeling, visit www.nahb.org/remodel.
Wednesday, July 28, 2010
New-Home Sales Bounce Back from Record Low in June
Coming off an historic low in May, sales of newly built, single-family homes rose 23.6 percent to a seasonally adjusted annual rate of 330,000 units in June, according to U.S. Commerce Department data released today.
“Today’s numbers are an encouraging sign that new-home sales are coming back from an expected slow period that followed the expiration of the home buyer tax credit program,” said Bob Jones, chairman of the National Association of Home Builders (NAHB) and a home builder from Bloomfield Hills, Mich. “While we still have quite a way to go on the path to recovery, it’s good to see that we are headed in the right direction.”
“It’s worth noting that some of the new-home sales in June were due to move-up buyers who were able to sell their previous home to a tax-credit-eligible buyer while that program was active,” said NAHB Chief Economist David Crowe. “Also, while sales activity is still far from robust, it has picked up some momentum as positive factors such as historic low mortgage rates, great selection and attractive prices help draw potential home buyers back to the market. We anticipate that this momentum will continue along with a gradually improving economy, although other factors such as a critical lack of production financing remain a drag on housing’s recovery.”
Sales of new homes rose strongly in three out of four regions in June. The largest percentage increase was the Northeast’s 46.4 percent gain, followed by a 33.1 percent gain in the South and a 20.5 percent gain in the Midwest. The West was the only region where new-home sales did not improve in June, instead falling 6.6 percent to a new record low.
Meanwhile, the nationwide inventory of new homes for sale declined to 210,000 in June, the thinnest it has been since September of 1968. This amounts to a 7.6 months’ supply at the current sales pace.
“Today’s numbers are an encouraging sign that new-home sales are coming back from an expected slow period that followed the expiration of the home buyer tax credit program,” said Bob Jones, chairman of the National Association of Home Builders (NAHB) and a home builder from Bloomfield Hills, Mich. “While we still have quite a way to go on the path to recovery, it’s good to see that we are headed in the right direction.”
“It’s worth noting that some of the new-home sales in June were due to move-up buyers who were able to sell their previous home to a tax-credit-eligible buyer while that program was active,” said NAHB Chief Economist David Crowe. “Also, while sales activity is still far from robust, it has picked up some momentum as positive factors such as historic low mortgage rates, great selection and attractive prices help draw potential home buyers back to the market. We anticipate that this momentum will continue along with a gradually improving economy, although other factors such as a critical lack of production financing remain a drag on housing’s recovery.”
Sales of new homes rose strongly in three out of four regions in June. The largest percentage increase was the Northeast’s 46.4 percent gain, followed by a 33.1 percent gain in the South and a 20.5 percent gain in the Midwest. The West was the only region where new-home sales did not improve in June, instead falling 6.6 percent to a new record low.
Meanwhile, the nationwide inventory of new homes for sale declined to 210,000 in June, the thinnest it has been since September of 1968. This amounts to a 7.6 months’ supply at the current sales pace.
Friday, July 16, 2010
Restoring AD&C Lending Key to Promoting Job and Economic Growth
With the Obama Administration and Federal Reserve this week sponsoring events that focus on how to ease regulatory burdens on the small business community that are constricting job growth, the National Association of Home Builders (NAHB) today urged policymakers to address the lack of financing for housing production that is impeding the housing and economic recovery.
"In normal times, housing accounts for about 17 percent of GDP," said NAHB Chairman Bob Jones, a home builder from Bloomfield Hills, Mich. "However, in the current economic climate, lenders have basically stopped making acquisition, development and construction (AD&C) loans and are calling in existing loans, even when the borrower's payments are current. Policymakers must act now to restore credit availability for viable home building projects; otherwise countless construction jobs will be lost, further jeopardizing the fragile economic recovery."
Federal Reserve Chairman Ben Bernanke said that the objective of a conference today at the Federal Reserve is to develop policies that will support the flow of loans to creditworthy small businesses. Meanwhile, the White House has asked business leaders and lawmakers to attend a jobs summit at the U.S. Chamber of Commerce on Wednesday to help identify regulatory obstacles that are hampering job and economic growth.
NAHB is reaching out to regulators, banks, Administration officials and members of Congress to seek action to reduce regulatory restrictions on AD&C credit and rein in overzealous bank examiners.
The vast majority of NAHB builder members are small businesses situated in communities across the nation who employ workers that contribute to the local economic base. NAHB estimates the one-year local impacts of building 100 single-family homes in a typical metro area result in the creation of 324 local jobs and an additional $21.1 million in local income and $2.2 million in taxes and other revenue for local governments.
Beyond its negative effect on home builders, the lack of AD&C lending has major implications for the economy and the nation, said Jones.
"Over the next decade, population growth will trigger demand for an average of at least 1.7 million additional homes per year," he said. "This translates into five million jobs and significant economic activity, including tax revenue. But without increased AD&C lending, this demand will not be met, jobs will be lost and job creation will suffer."
"In normal times, housing accounts for about 17 percent of GDP," said NAHB Chairman Bob Jones, a home builder from Bloomfield Hills, Mich. "However, in the current economic climate, lenders have basically stopped making acquisition, development and construction (AD&C) loans and are calling in existing loans, even when the borrower's payments are current. Policymakers must act now to restore credit availability for viable home building projects; otherwise countless construction jobs will be lost, further jeopardizing the fragile economic recovery."
Federal Reserve Chairman Ben Bernanke said that the objective of a conference today at the Federal Reserve is to develop policies that will support the flow of loans to creditworthy small businesses. Meanwhile, the White House has asked business leaders and lawmakers to attend a jobs summit at the U.S. Chamber of Commerce on Wednesday to help identify regulatory obstacles that are hampering job and economic growth.
NAHB is reaching out to regulators, banks, Administration officials and members of Congress to seek action to reduce regulatory restrictions on AD&C credit and rein in overzealous bank examiners.
The vast majority of NAHB builder members are small businesses situated in communities across the nation who employ workers that contribute to the local economic base. NAHB estimates the one-year local impacts of building 100 single-family homes in a typical metro area result in the creation of 324 local jobs and an additional $21.1 million in local income and $2.2 million in taxes and other revenue for local governments.
Beyond its negative effect on home builders, the lack of AD&C lending has major implications for the economy and the nation, said Jones.
"Over the next decade, population growth will trigger demand for an average of at least 1.7 million additional homes per year," he said. "This translates into five million jobs and significant economic activity, including tax revenue. But without increased AD&C lending, this demand will not be met, jobs will be lost and job creation will suffer."
Subscribe to:
Posts (Atom)